mdxplain Overview
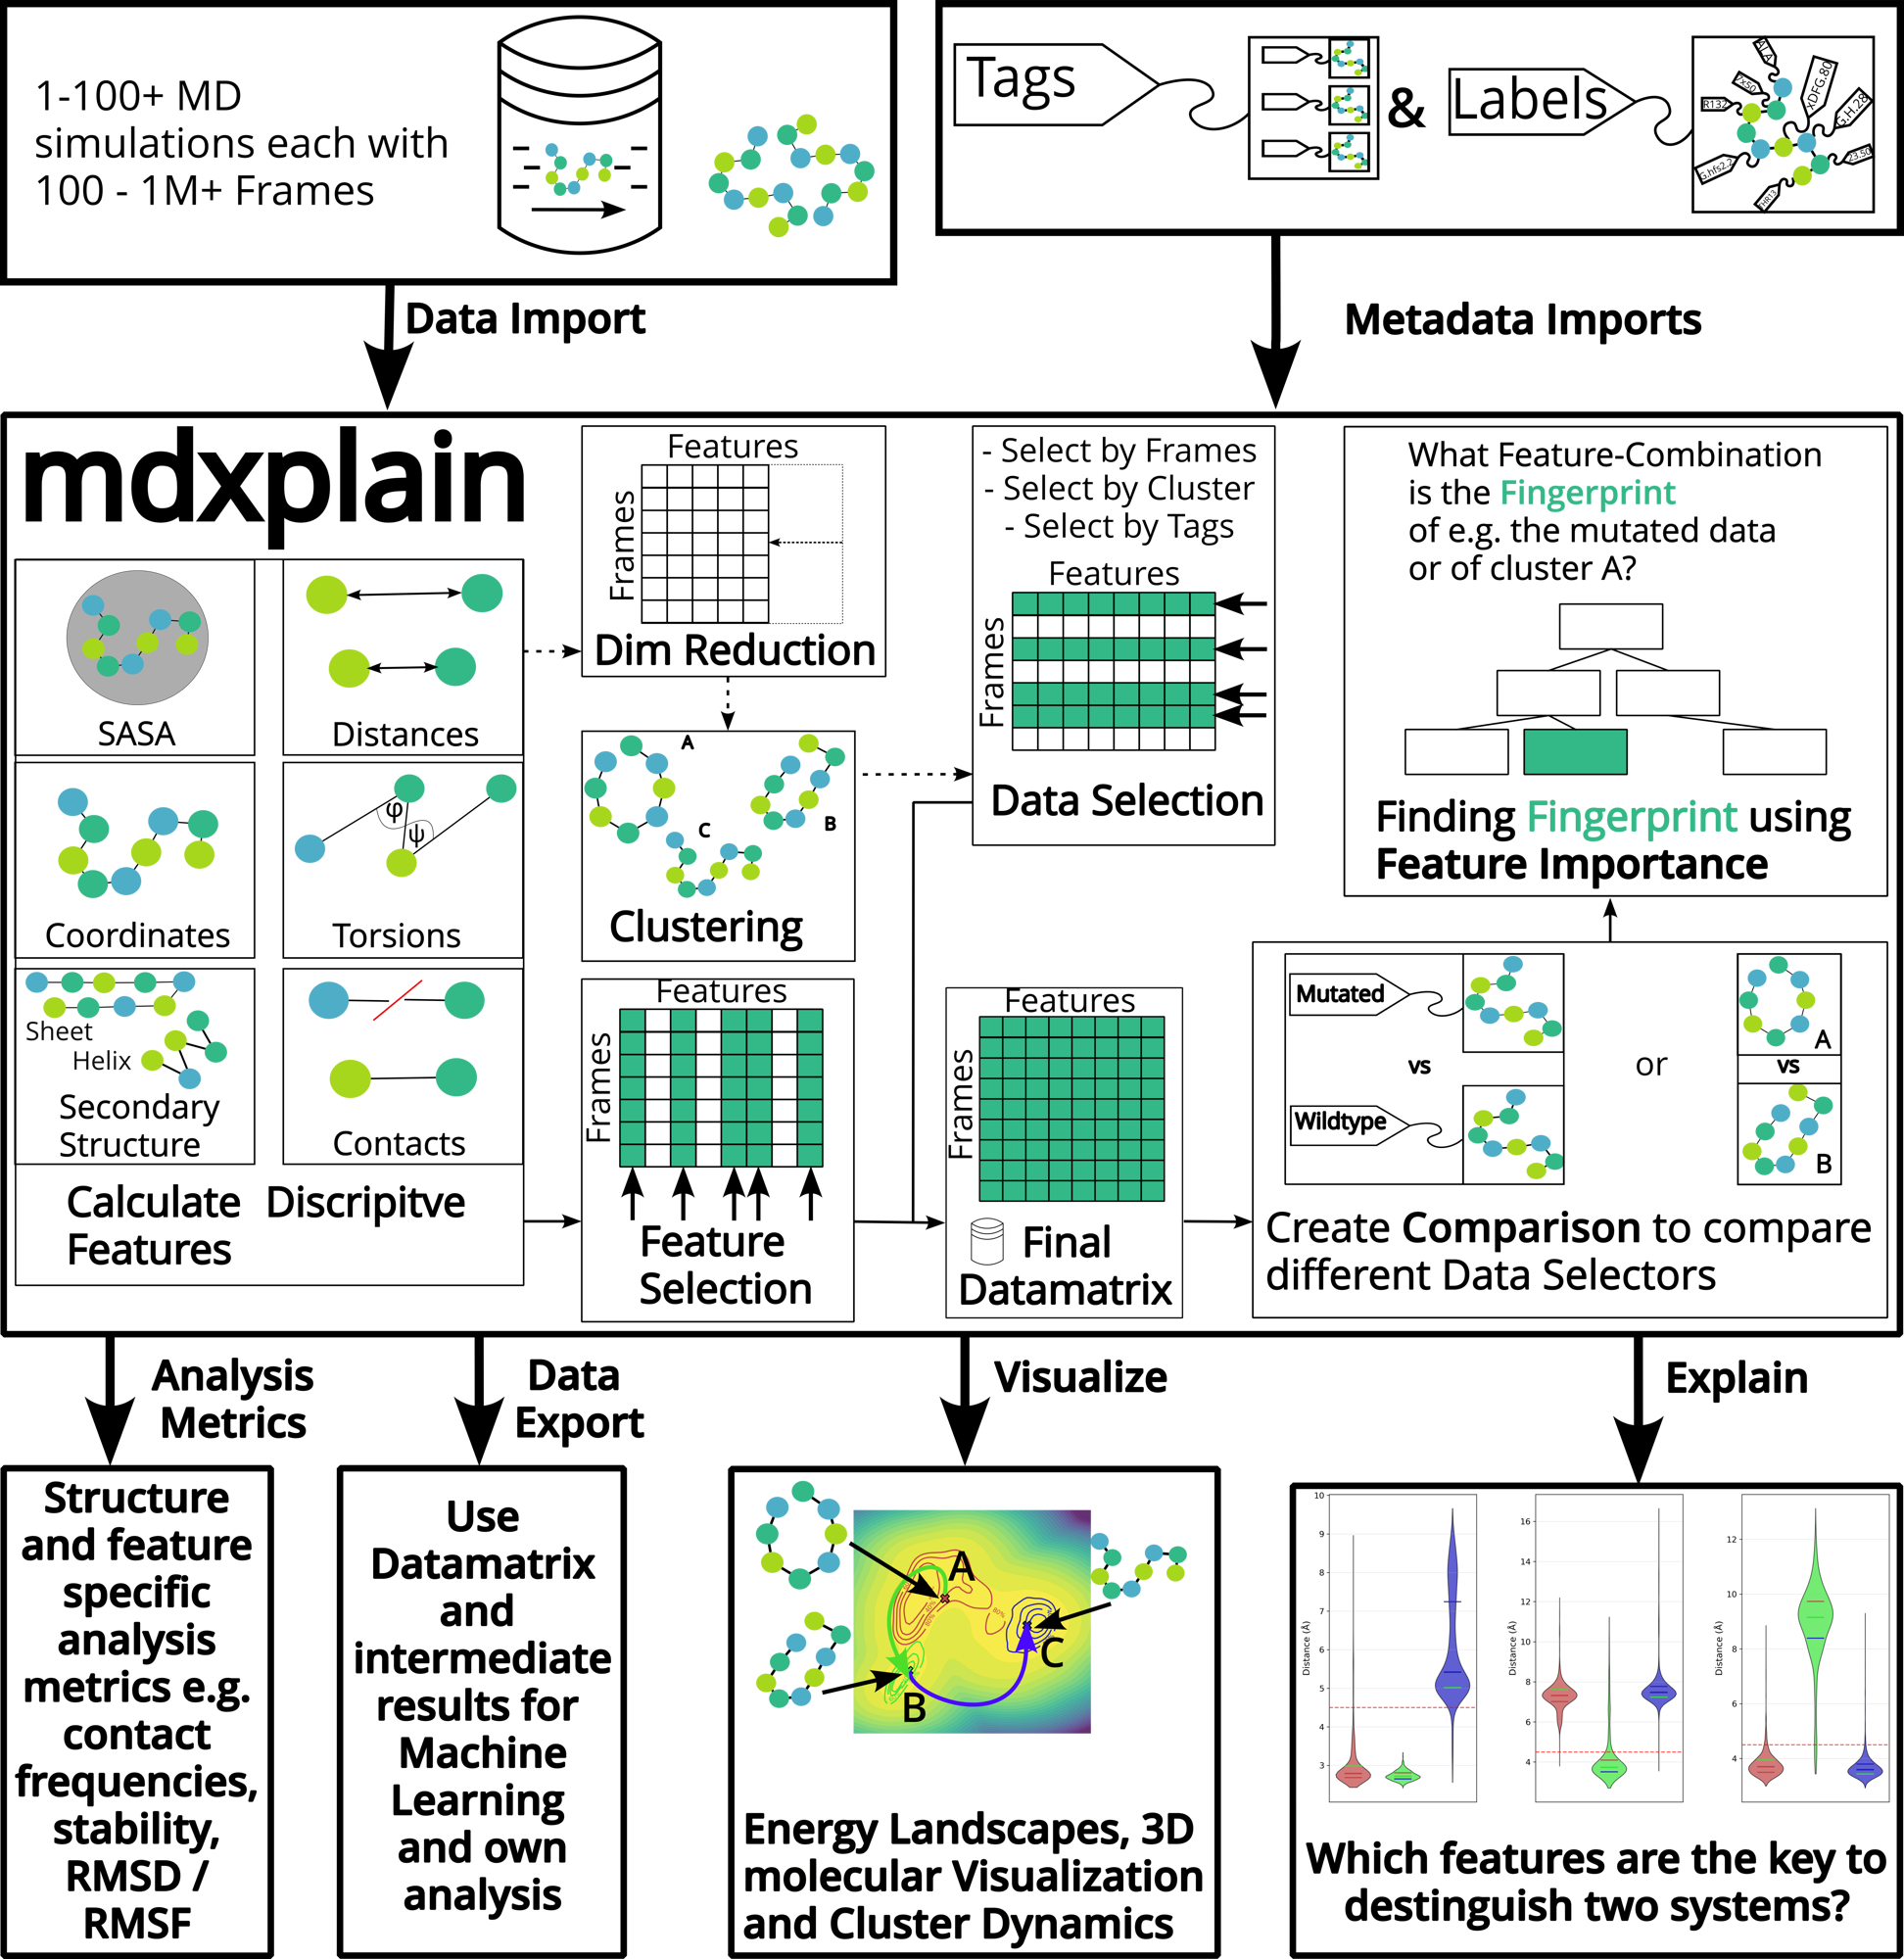
mdxplain creates a complete analytical loop from raw simulation data to explainable observations. The framework transforms large-scale trajectory data into interpretable insights through feature calculations, dimensionality reduction, clustering and comparisons.
Data Input
The pipeline begins with massive datasets compromising of 1-100+ MD simulations, each containing 100 to over a million frames. The tagging system allows classification of different simulation conditions, mutations, or experimental variants. Both the raw data and associated metadata (tags and labels) are imported.
mdxplain Tools
1. Feature Calculation
Central to mdxplain is the feature extraction engine that computes a multitue of descriptive features from the simulation trajectories.
Distances
Contacts
Torsions
DSSP secondary structure
Solvent accessible surface area (SASA)
Atomic coordinates
Through these features, high-dimenional data is transformed for efficient computational analysis.
2.1 Dimensionality Reduction and Clustering
The extracted features undergo dimensionality reduction to identify the most informative patterns while reducing computational complexity. mdxplain offers different statistical metrics for reduction.
Decomposition methods:
PCA (Principal Component Analysis)
Kernel PCA
Contact Kernel PCA
Diffusion Maps
Clustering methods:
DPA (Density Peak Advanced)
DBSCAN (Density-Based Spatial Clustering)
HDBSCAN (Hierarchical DBSCAN)
2.2 Feature Selection
The system identifies the most relevant features that capture essential molecular behavior. Different metrics (e. g. variance, range, transition, etc.) can be applied to help priortize features across different simulations.
3. Data Selection and Matrix Construction
User can select specific subsets of data based on frames, clusters or tags to further narrow down.
The target data from data selection or feature selection is organized into a final datamatrix. The rows represent frames and the columns represent features.
4. Comparison
mdxplain supports the systematic comparison of different datasets, such as mutated vs wildtype proteins.
5. Explainability Through Feature Importance
At the core of mdxplain is its use of feature importance analysis to identify which molecular feature-combination serves as system-specific “fingeprint”. Decision-tree-like visualization highlight the features that best separate sytems, reframing the question from “what happened?” to “why did it happen?”.
Data Output
mdxplain provide comprehensive output options:
Analysis Metrics
Data Exports
Visualizations
Energy Landscapes
3D molecular Visualization
Cluster Dynamics
Decision Trees